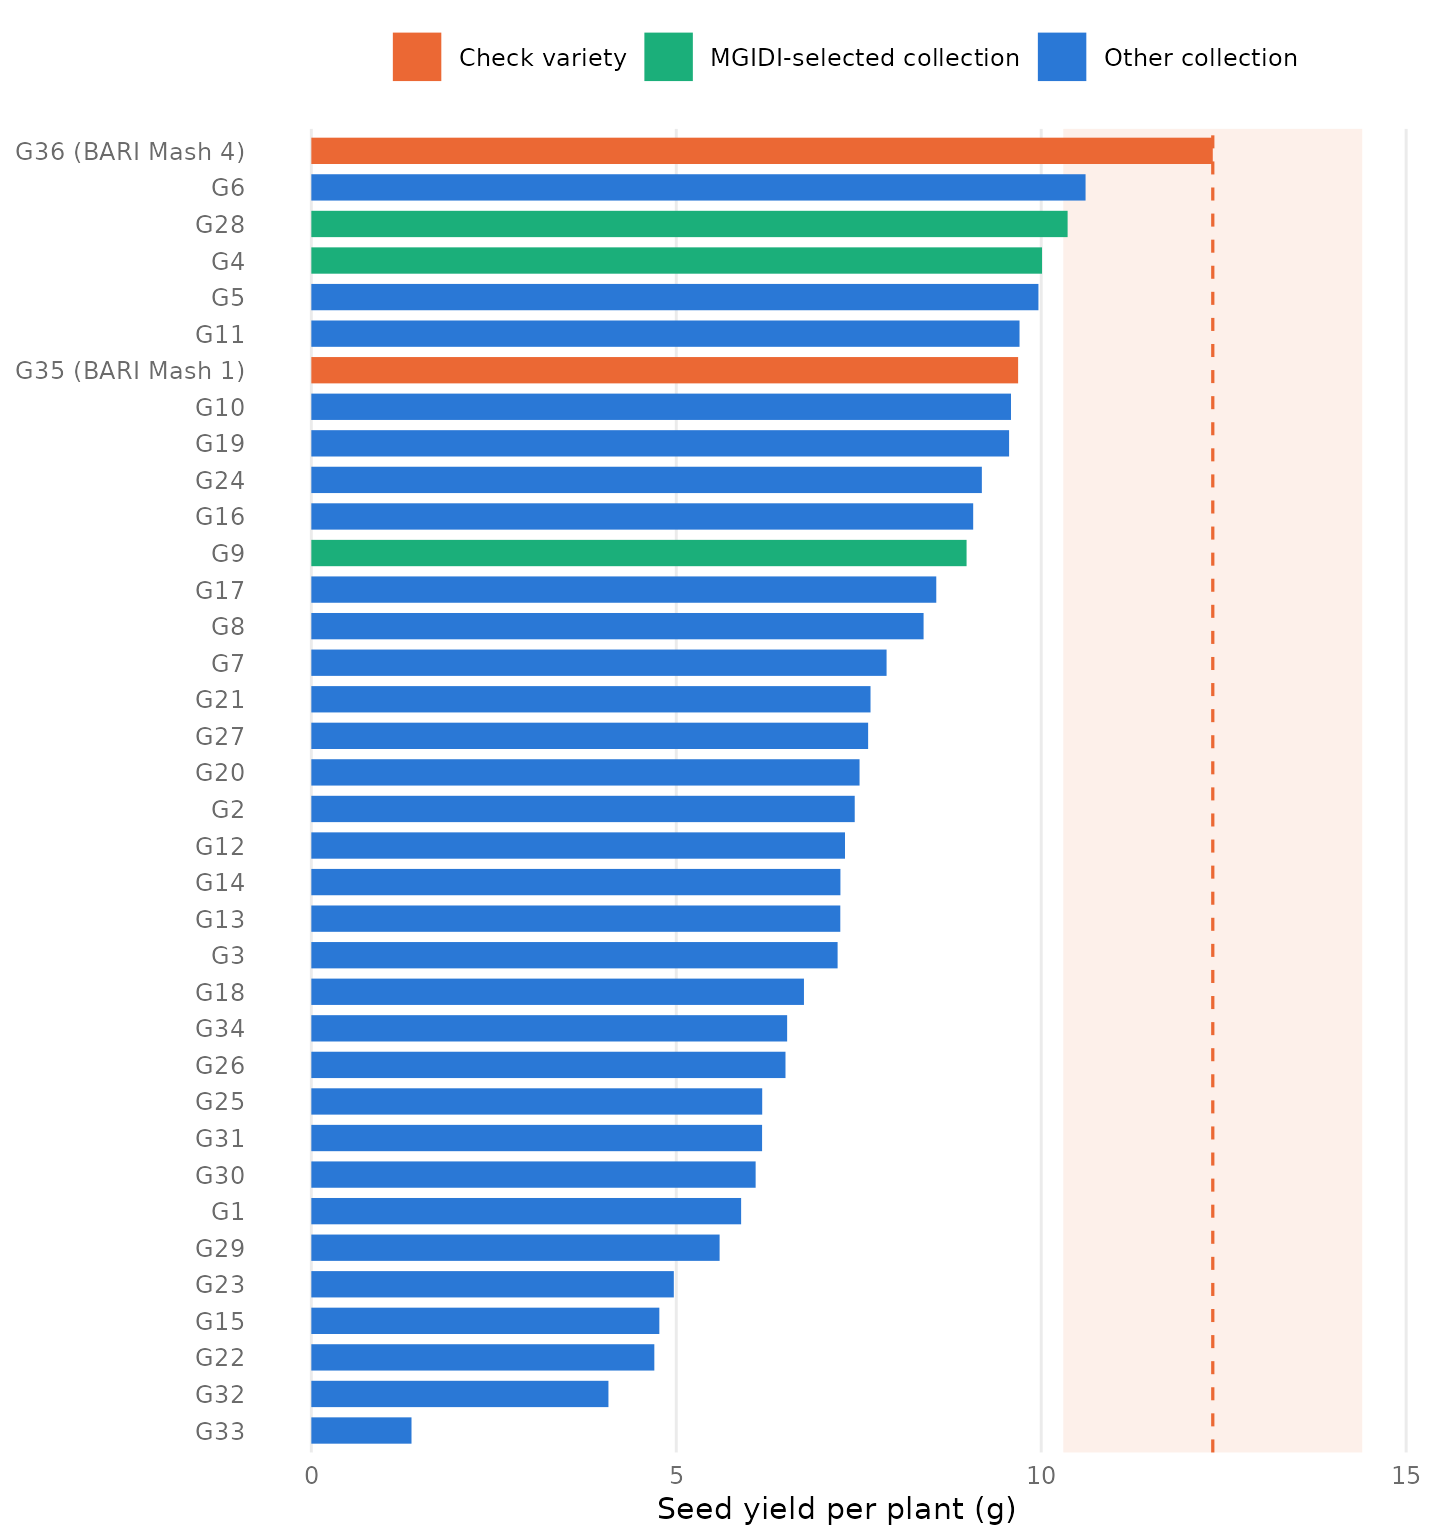
A complete quantitative-genetics pipeline on one season of blackgram data: 36 genotypes (34 local collections + BARI Mash 1 and BARI Mash 4) × 3 replications in RCBD, 14 traits recorded on a plot basis.
Traits covered phenology (days to first flowering, 50 % flowering, physiological maturity), plant architecture (height, branches, leaf greenness), yield components (clusters per plant, pods per cluster, pod length, seeds per pod, single-pod weight, thousand-seed weight), first-harvest percentage, and seed yield per plant.
All analyses used the plot-level modely = μ + replication + genotype + error
(error df = 70). Variance components, heritability and genetic advance were calculated on a single-plot basis so that the results stay transparent and reproducible.
Genotypes differed significantly for every trait (P < 0.01 for 13 traits; P < 0.05 for seeds per pod). The same held when the two released checks were removed and only the 34 local collections were tested.
Variability and heritability
Only seed yield per plant showed high GCV (27 %). High broad-sense heritability combined with high genetic advance as percent of mean appeared for just two traits: seed yield (h² ≈ 73 %, GAM ≈ 48 %) and single-pod weight (h² ≈ 64 %, GAM ≈ 23 %). For seven traits the plot error variance was equal to or larger than the genotypic variance, so selection on those traits needs replicated means rather than single-plant scores.
Character association
Yield was positively associated with all pod and seed traits and negatively with days to flowering and maturity. Sequential path analysis (yield as the product of its components) identified the largest genotypic direct effects from pods per cluster, clusters per plant and seeds per pod. A conventional single-stage path ranked single-pod weight and pods per cluster highest.
Genetic diversity
Ward clustering on standardised means produced five clusters. Both checks fell in the largest, earliest and highest-yielding group. One extremely poor-podding genotype formed a singleton cluster. Leaf greenness, days to maturity and seed weight contributed most to Mahalanobis D² divergence.
Multi-trait selection (MGIDI)
At 15 % intensity the index selected G9, BARI Mash 1, G28, BARI Mash 4 and G4. When the checks were excluded, the same three collections plus G10 and G6 were chosen. The selected collections are balanced across trait groups and early, yet each still yields 14–27 % less than the best check in this environment.
Every major result (ANOVA mean squares, heritability parameters, correlations, path coefficients, cluster membership, Mahalanobis distances, MGIDI ranks and Duncan groupings for yield) was recomputed from first principles in Python (NumPy / SciPy). All 802 numeric checks agreed within rounding error. That cross-language verification is part of the delivered analysis.
Related reading on this site: the earlier note on trait associations and the field-scoring notes from the same trial series. A multi-environment extension of the work is available as a preprint.